
Our first article on diabetes proved to be really popular and we talked about how we get diabetes, why its on the rise in Singapore and what we should do about it. If you haven’t read that then read that first to give you a good primer: How can Singaporeans reverse type 2 diabetes? In this article we’re going to take a much deeper dive into the single largest contributing factor to diabetes which is blood glucose management and insulin sensitivity. This is a massive issue in Singapore which is why PM Lee brought it up in his National Day speech last year. If you are already diabetic then you’ll know all about it but even if you don’t you’ll want to read this if you’re even remotely interested in your health, losing weight, graceful aging and longevity. So read on to reveal our 6 steps to managing and curing diabetes mellitus with cutting-edge technology.
Insulin sensitivity, health, weight loss and longevity
So let’s say you’re not diabetic. Why should you care about insulin sensitivity?
- If you are insulin resistance (from, for example, eating too many refined carbohydrates and sugary foods) your body has less capacity for storing excess glucose from those consumed foods. So basically you’re going to store excess glucose as fat, to be helpfully used in the winter when you run out of food! But of course we don’t run out of food any more, in the developed world at least. So you just get fat and high insulin also inhibits the breakdown of fat.
- So we want to increase insulin sensitivity to create more stores for the excess glucose in our muscles. Following Levitise’s 10 Key Elements of Health, Happiness and Longevity is key to that process. This provides us with a greater capacity to store excess glucose, which is useful if we do slip on our dietary choices, and generally keeps our blood glucose at a more normal ancestral level, that we are genetically equipped to handle more efficiently.
- People have known for years that calorie restriction is one of the keys to longevity and, indeed, many of the blue zones (regions with a very high % of centenarians) employ mindful eating until you’re only 80% full and periods of fasting. The key component of this now appears to be in keeping insulin low well into old age.[1][2]
So even if you’re not technically diabetic keeping your blood glucose low (relatively) is key to general good health, weight loss and longevity. You can read more about blood sugar and insulin in the sidebar below if you're unfamiliar with this subject.
Taking a deeper dive into blood glucose management
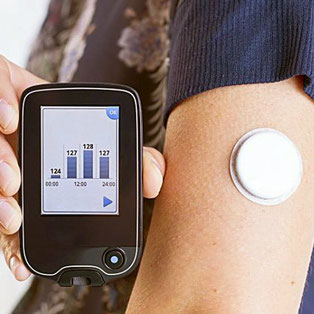
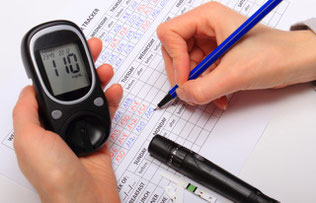
For the last 2 weeks I’ve been wearing a 24 hour continuous blood glucose monitor in an effort to experiment with different foods to find out which make me fat and pre-diabetic and which don’t. This is all based on the principals of personalised nutrition and the notation that some foods work for some people and not for others. How did I develop the questions that lead to this hypothesis? A number of reasons:
- I always wondered why, through observation, when some Chinese people move to England they put on weight the longer they stayed
- Why do some people in the same family get fat and others not when they’re all largely eating the same diet?
- Why do Singaporeans have a higher rate of diabetes than the Americans?
- Why are the kids getting fatter here than when I first arrived almost 20 years ago?
Personalised Nutrition
In my 7+ years of heavy research into nutrition and health I made a couple of key discoveries. The first was the concept of metabolic typing which triggered me to study Primal Pattern Diet TypingTM and individualised diets at the C.H.E.K. Institute in San Diego.
And then more recently I came across a scientific paper that really addressed how people can have very different blood sugar responses to certain foods. They took 800 people and put them on continuous blood glucose monitors and then tracked their blood glucose responses after eating certain meals with fixed amounts of carbohydrates (50g). What they found was a high variability in the response to identical meals, suggesting that universal dietary recommendations may have limited utility. For example, some people ate a meal with all of the carbohydrates coming from chickpeas and had a massive blood glucose spike, and others the needle hardly moved at all. The same with bread.
Take a look at this:
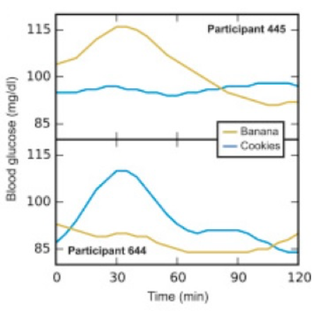
Participant 445’s blood sugar spikes to 115mg/dl after eating bananas (you might be more familiar with mmol/l so just divide by 18 to get 6.4 mmol/l in this case). However there was no change (around 95) in their blood sugar when they ate some cookies. This would suggest this person has more trouble clearing glucose from bananas from their system rather than the glucose derived from cookies.
However, with participant 644 their blood sugar rose to 115 when eating cookies but was not really affected much when eating a banana, it actually fell about 7 mg/dl. This would suggest that cookies are the ‘Achilles heel’ for participant 644.
Checking the Glycemic Index of Morning Coffee™ cookies over at www.glycemicindex.com reveals that they have a Glycemic Index of 79 (100 being the worst or 100% pure glucose and 0 being the best). Raw bananas have a GI of 53. Most doctors, dieticians and nutritionists’ advice for their diabetic patients’ is based on the glycemic index and government food pyramids which have been heavily influenced by food manufacturers. This is a real problem as they could be eliminating healthy foods that are not causing problems and obviously the far worse case of leaving in foods that are a serious problem by causing massive blood sugar spikes.
And then, lastly, I read Robb Wolf’s book, Wired to Eat, which sets out some guidelines on how to replicate this experiment yourself. So I ordered a continuous blood glucose monitor, slapped it on, and started recording my measurements.
|
Sidebar - blood sugar, why do we care?
Quite simply we have not been genetically manufactured to handle the shear quantities of cheap, refined carbohydrates that we consume these days. The reason we do eat them is because they’re cheap, prolific and rather addictive. Our genetic wiring rewards us with ‘happy brain chemicals’ when we seek out these foods as they were traditionally difficult to find in nature.
This overconsumption causes chronic hyperglycemia (high blood glucose) which leads to kidney damage, neurological damage, cardiovascular damage, damage to the retina, damage to feet and legs, type 2 diabetes, diabetic neuropathy, growth impairment and susceptibility to infections.
We want to keep blood sugar low. Not very low (low carb/keto is not the answer for everyone) but just much lower than what is the current average in the modern world. If you look at the works of longevity researchers such as Dr. Peter Attia they draw very clear inverse correlations between chronically elevated blood glucose and longevity. So its not just about diabetics but everyone. |
||
The experiment
So what I decided to do was to test my blood glucose at the beginning of every meal and then every 30 minutes up until the 2 hour mark. I only did this at breakfast, 45 mins after waking up every morning, to ensure that no other variables would interrupt the readings. Foods eaten previously that day, exercise, stress could all have an impact which is why it was best to run the test first thing in the morning.
The results
The first test I ran was with sourdough bread. I had to eat 96g of sourdough bread in order to ensure that I would consume exactly 50g of carbohydrates (the macronutrient largely responsible for blood sugar spikes). The rest of the weight of the bread (46g) being made up of protein, fat and water.
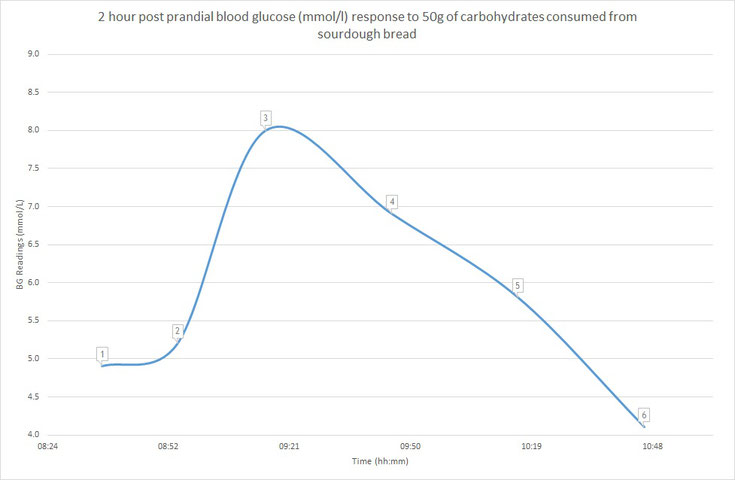
So here’s how to interpret this chart:
Label 1: this is when I started eating, blood sugar at 4.9 mmol/l
Label 2: this is when I finished eating, blood sugar at 5.2
Label 3: at 9:16am, 30 mins after the midway point of eating, my blood sugar spiked from 4.9 to 8.0 mmol/l. Quite a big spike with a rise in blood sugar of 3.1. So this would indicate that the amount of glucose in my body is now much higher than the necessary amount of insulin available to put it to good use and shuttle it off into glycogen stores or fat cells.
Label 4: 30 mins later it fell to 6.9 indicating that my pancreas (the bodily organ responsible for insulin production) has now kicked into gear and is working pretty hard to secrete enough insulin to remove excess glucose from circulation
Label 5: another 30 mins later, at 10:16, it fell to 5.8.
Label 6: and then on the 2-hour mark my blood glucose actually fell below my starting value of 4.9 to 4.1. This could indicate that my pancreas was working way too hard and produced too much insulin and has now mopped up too much blood glucose and I have slipped slightly into hypoglycaemia (low blood sugar). It could also mean that my baseline was a bit high for that morning.
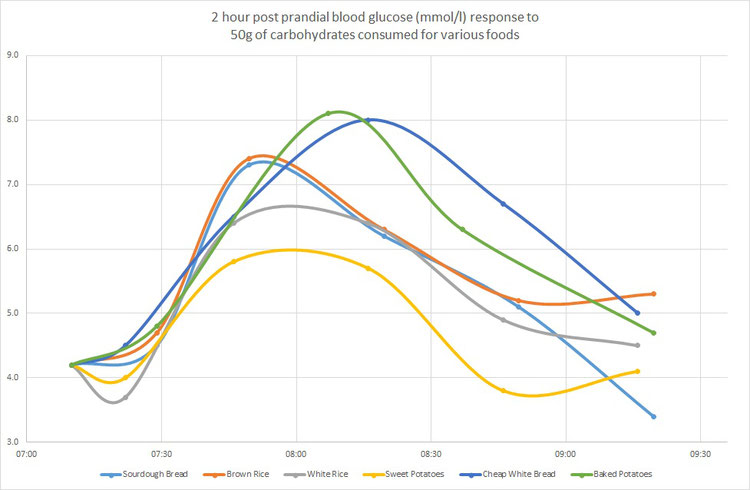
OK so I did the above exercise for the following food items (1) sourdough bread, (2) white rice, (3) brown rice, (4) sweet potato, (5) cheap white bread and (6) baked potatoes. I plotted them all on the same graph by rebasing their values to an average blood glucose starting value for comparative purposes. And got this:
Interpreting the results
So I like to look at this 3 ways:
Peak: the largest peaks were for cheap white bread and baked potatoes sending my blood sugar through the roof to around 8 mmol/l. This would indicate that I’m hyper sensitive to these 2 foods and that my pancreas is going to have to do the equivalent of High Intensity Interval Training to mop up all this glucose and bring my blood sugar levels back to normal. A knackered pancreas leads to broken beta cells leads to pre-diabetes leads to diabetes. I seem to tolerate sweet potatoes much better however with the peak only being only 6 mmol/l in response to eat these.
AUC: the area under the curve. The total area under the curve is indicative of the total amount of insulin produced by my pancreas in response to the food eaten. The larger this number the worse this is likely to be for my health. And this was the case again for the white bread and white potatoes. The AUC for the white bread and white potatoes were 4 times higher than for sweet potatoes.
2-hour post prandial response: so this should be below 7.2mmol/l (as recommend by the American Diabetes Association) to avoid a diabetes suspicion and luckily all of mine were. However, looking at the difference between the start and end point is interesting. Brown rice and white bread were both about 1 mmol/l above the baseline indicating that I was struggling to fully clear the excess blood glucose even after 2 hours. And in the case of the sourdough bread it seems that my pancreas was overzealous, released too much insulin resulting in a small 2 hour post prandial blood sugar crash - this is not ideal either.
Conclusions
So what can we conclude from this experiment? Well the first is that it’s bloody difficult to design an experiment such as this for a population of N=1 let alone doing this as part of a randomised double blind placebo controlled scientific study. There were so many variables/accurate data that I couldn’t pin down including:
- Varying starting blood glucose values
- How accurate is the number of carbs in each food source
- Being consistent with taking blood glucose readings when real life gets in the way
- The affects of previous night’s meal or previous day’s exercise regime
- Are the results repeatable?
However, despite all these if we assume the results are ball park ‘ok’ then we can draw the following conclusions for me:
- White bread and potatoes should be avoided. I don’t eat bread anyhow but potatoes I like so I’ll probably limit them to once a week and a smaller portion.
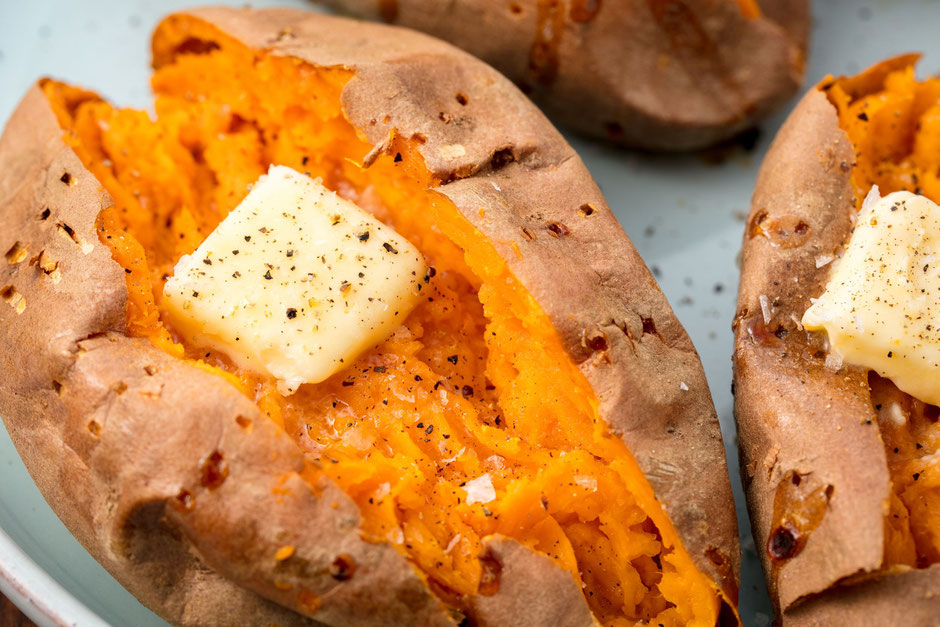
- Sweet potatoes seem to be the best carb source for me so I’ll be getting a lot more of them in: orange ones, purple ones, yellow ones etc. Incidentally one of the main differences between the Okinawans (the famous centenarians) and the rest of the Japanese is that they eat sweet potatoes rather than white rice as their main starchy carbohydrate source so if it works for them…
- Sourdough bread I eat rarely so that’s not a big issue.
- I used to eat a lot more brown rice than white rice but it seems that it takes a while for me to clear that from my system – maybe because the glucose is more tightly bound up in the bran as well as the more easily available endosperm (the white bit). I still will have a preference for brown rice because it’s much more nutritious (after being soaked and sprouted) but I’ll be less worried about tucking into white rice in the future when accompanying a large portion of beef redang!
And just to be clear again these conclusions only apply to me and no one else on the planet! This is an experiment of N=1.
So, who should run these tests?
If you have diabetes or pre-diabetes you definitely want to be more accurately looking into various foods in isolation and how they impact your blood sugar. If you’re interested in weight loss then minimising the area under the curve will be key to ensuring you’re not shuttling all that extra glucose straight into fat cells. And finally, anyone interested in increased insulin sensitivity and the knock-on benefits for longevity then this protocol would be highly beneficial.
OK so how do you do this yourself? Just follow our guide below.
STEP 1
Grab a blood glucose device from either your doctor, Amazon, Ebay or the continuous one I used from Abbott.
STEP 2
Next come up with a list of all the carbohydrates that you eat regularly (at least more than once a week): noodles, rice, pasta, pizza, bread, potatoes, sweet potatoes, fruit, crackers, biscuits, sugary drinks, coke, alcohol
STEP 3
Calculate the amount of each food item you need to eat in order to consume 50g of carbs – you can use https://cronometer.com/ or https://nutritiondata.self.com/ or get Robb Wolf's book.
STEP 4
Pick a time that you are going to eat the carbs every morning, say 7am, and eat only that amount of carbs and nothing else for the next 2 hours – don’t drink any caffeine, sugary drinks or anything else that might interfere. Just water.
STEP 5
Take your blood glucose reading at the start of the meal, 30 mins after and every 30 mins after that until you hit the 2-hour mark.
STEP 6
Once you have a whole bunch of readings, you then have some great data to play with. A good start is plotting them in Excel and just eye balling the results. That will give you a great visual idea of what’s going on. For those that geek out on the data, I’m sure you’ll know what to do! As much as I’d love to give you a hard and fast rule like, “remove any foods that have a score of more than X, Y, Z” a blanket rule for everyone is not going to be accurate as we are all so different that we need individualised solutions. But we love looking through this data so if you’re stuck just send it over to us and we’ll help you out.
Wrapping up...

So that’s it. A simple 6 step protocol for helping you to permanently work out which foods work, or don’t work for you, to help reverse diabetes, lose weight and strive for longevity.
For more information I highly recommend reading Robb Wolf’s book, “Wired to Eat”[3], this scientific paper: Personalized Nutrition by Prediction of Glycemic Responses[4] and our first article on diabetes called How can Singaporeans reverse type 2 diabetes? that looked at how nutrition, sleep, emotions, thinking and exercise and other lifestyle factors can all impact this common but serious disease in Singapore.
To your health, happiness and longevity
The Levitise Team
P.S. If you love this blog post then do check out our fortnightly newsletter where you'll get the freshest content on health, nutrition and fitness delivered straight to your inbox. Don't miss out and sign up here with just your name and email.
[1] Clinical Experience of a Diet Designed to Reduce Aging, 2009. https://www.ncbi.nlm.nih.gov/pmc/articles/PMC2831640/
[2] The effects of intentional weight loss as a latent variable problem, 2005. https://www.ncbi.nlm.nih.gov/pubmed/15717333
[3] Wired to Eat, Robb Wolf, 2017. https://robbwolf.com/wiredtoeat/
[4] Personalized Nutrition by Prediction of Glycemic Responses, 2015. https://www.cell.com/fulltext/S0092-8674(15)01481-6#%20
Write a comment